E-commerce Pricing Strategy
Introduction
Crafting an effective pricing strategy for e-commerce can be complex, but leveraging data through insightful dashboards can streamline the process. In this blog entry, we’ll explore how to utilize a pricing strategy dashboard to optimize profit potential, manage inventory, and enhance your e-commerce business’s overall efficiency. This guide is tailored for e-commerce retailers seeking to maximize profitability through informed, strategic pricing decisions.
Dashboard Overview: Key Metrics for Pricing Strategy
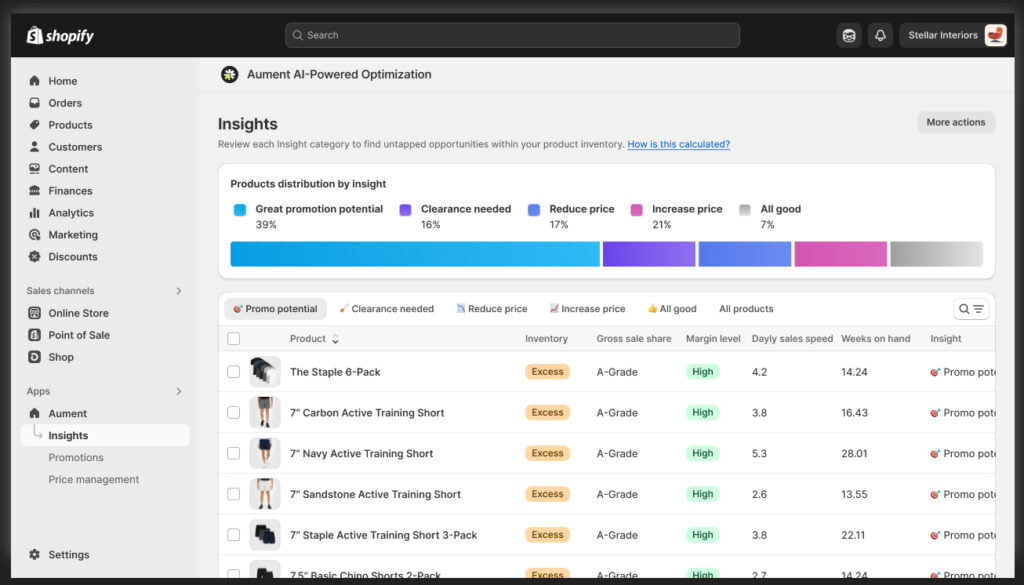
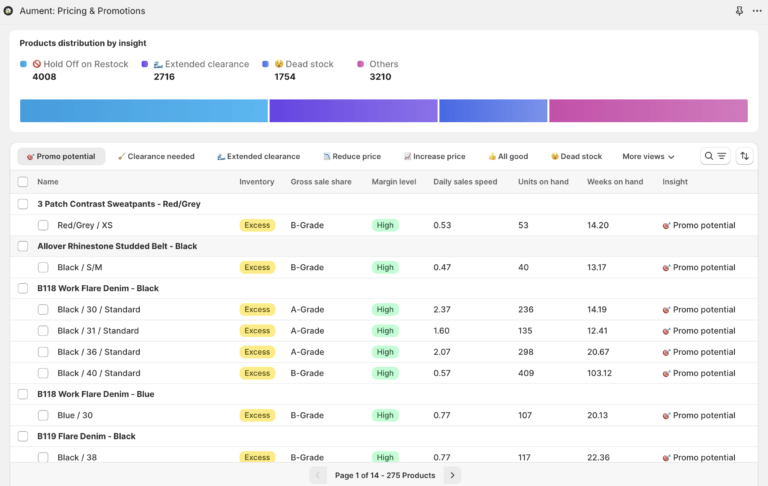
The Pricing Strategy Dashboard is a powerful tool designed to identify profit potential opportunities by analyzing four key metrics: inventory status, gross sales share, margin levels, and overall sales performance. By integrating these metrics, the dashboard provides actionable recommendations to enhance your pricing strategy and inventory management.
Categories and Recommendations
The dashboard categorizes products into several actionable segments, each requiring specific strategies to optimize profitability:
- Promotion Potential 🎯
- Characteristics: Products with excess inventory, high or medium gross sales share, and significant margins.
- Strategy: Leverage these products during promotional periods to boost sales or counteract slow sales phases. They are ideal for driving revenue through discounts or special promotions.
- All Good! 👍
- Characteristics: Products across various inventory levels and sales shares, with balanced margins.
- Strategy: Maintain current strategies as these products are performing well without immediate need for adjustments.
- Clearance Needed 🚨
- Characteristics: Products with excess inventory, lower sales share, and high or medium margins.
- Strategy: Focus on clearing these items through discounts or clearance sales to free up storage space and reduce carrying costs.
- Free Gift Opportunity 🎁
- Characteristics: Products with low margins and slow movement, either in excess or balanced inventory.
- Strategy: Bundle these items as free gifts with purchases to increase perceived value without impacting profitability significantly.
- Price Reduction 📉
- Characteristics: Slow-moving products with balanced inventory and high or medium margins.
- Strategy: Reduce prices to stimulate demand and accelerate sales, ensuring these items do not become stagnant stock.
- Consider Price Increase 📈
- Characteristics: Best-selling products with limited inventory and medium-low margins.
- Strategy: Slightly increase prices to manage demand and enhance profitability until the next supply order arrives.
- Restock Immediately 🚚
- Characteristics: High-demand products nearing stock depletion across various margins.
- Strategy: Prioritize restocking these items to avoid stockouts and lost sales opportunities.
- Hold Off on Restock 🚫
- Characteristics: Products with stock shortages but lower sales share.
- Strategy: Avoid restocking these items to prevent unnecessary inventory buildup and potential markdowns.
- Review Items
- Characteristics: Items with no sales in the past 30 days or no cost of goods (COGs) data.
- Strategy: Investigate these products to determine the cause of the lack of sales and take corrective actions.
Detailed Matrix Configuration
The dashboard uses a detailed matrix to categorize products based on inventory status, gross sales share, and margin levels. Here’s how items are categorized and recommended actions are determined:
| Recommendation | Inventory Status | Gross Sales Share | Margin |
|---|
| Promotion Potential 🎯 | Excess Inventory | A and B Grade | High, Medium |
| All Good! 👍 | Excess Inventory | A and B Grade | Low, At Cost, Monetary Loss |
| Clearance Needed 🚨 | Excess Inventory | C, D, E Grade | High, Medium |
| Free Gift Opportunity 🎁 | Excess Inventory | C, D, E Grade | Low, At Cost, Monetary Loss |
| All Good! 👍 | Balanced Inventory | A, B Grade | All Margins |
| Consider Price Reduction 📉 | Balanced Inventory | D, E Grade | High, Medium |
| Free Gift Opportunity 🎁 | Balanced Inventory | D, E Grade | Low, At Cost, Monetary Loss |
| Consider Price Increase 📈 | Limited Inventory | A and B Grade | Medium, Low, At Cost, Monetary Loss |
| All Good! 👍 | Limited Inventory | A and B Grade | High |
| All Good! 👍 | Limited Inventory | C, D, E Grade | High, Medium |
| All Good! 👍 | Limited Inventory | C, D, E Grade | Low, At Cost, Monetary Loss |
| Restock Immediately 🚚 | Stock Shortage | A, B, C Grade | All Margins |
| Hold Off on Restock 🚫 | Stock Shortage | D, E Grade | All Margins |
Metrics Breakdown
Gross Sales Share Categories
- E-Grade: Zero or less gross sales share.
- D-Grade: Gross sales share up to the 25th percentile.
- C-Grade: Gross sales share up to the 50th percentile.
- B-Grade: Gross sales share up to the 75th percentile.
- A-Grade: Gross sales share exceeding the 75th percentile.
Inventory Status Labels
- Stock Shortage: Negative weeks on hand.
- Limited Inventory: 0 to 4 weeks on hand.
- Balanced Inventory: 4 to 12 weeks on hand.
- Excess Inventory: More than 12 weeks on hand.
- Review Item: Null weeks on hand.
Margin Levels
- Monetary Loss: Negative margin by selling price.
- At Cost Price: Zero margin by selling price.
- Low: Margin greater than 0 but up to 0.1.
- Medium: Margin greater than 0.1 but up to 0.3.
- High: Margin greater than 0.3 but up to 1.
Conclusion
Implementing a data-driven approach to your e-commerce pricing strategy can significantly enhance your store’s profitability and operational efficiency. By utilizing the Pricing Strategy Dashboard, you can make informed decisions, optimize your inventory, and provide genuine value to your customers. Regularly updating and analyzing your pricing data ensures that your strategy remains agile and responsive to market changes, keeping you ahead in the competitive e-commerce landscape.